Drivers
This subsection shows summary figures and charts for the User's drivers over a selected period — for all drivers at once or for one or more driver groups: trips, mileage, fuel consumption, violations and penalties. The data is built from drivers' trips, so drivers must be identified on the objects — for example, with keys. The same panel is available in the Drivers section.
The key-figure tiles at the top of the screen give totals for the whole period, and the charts below break them down: by day of the period, or for up to 10 drivers with the highest values.
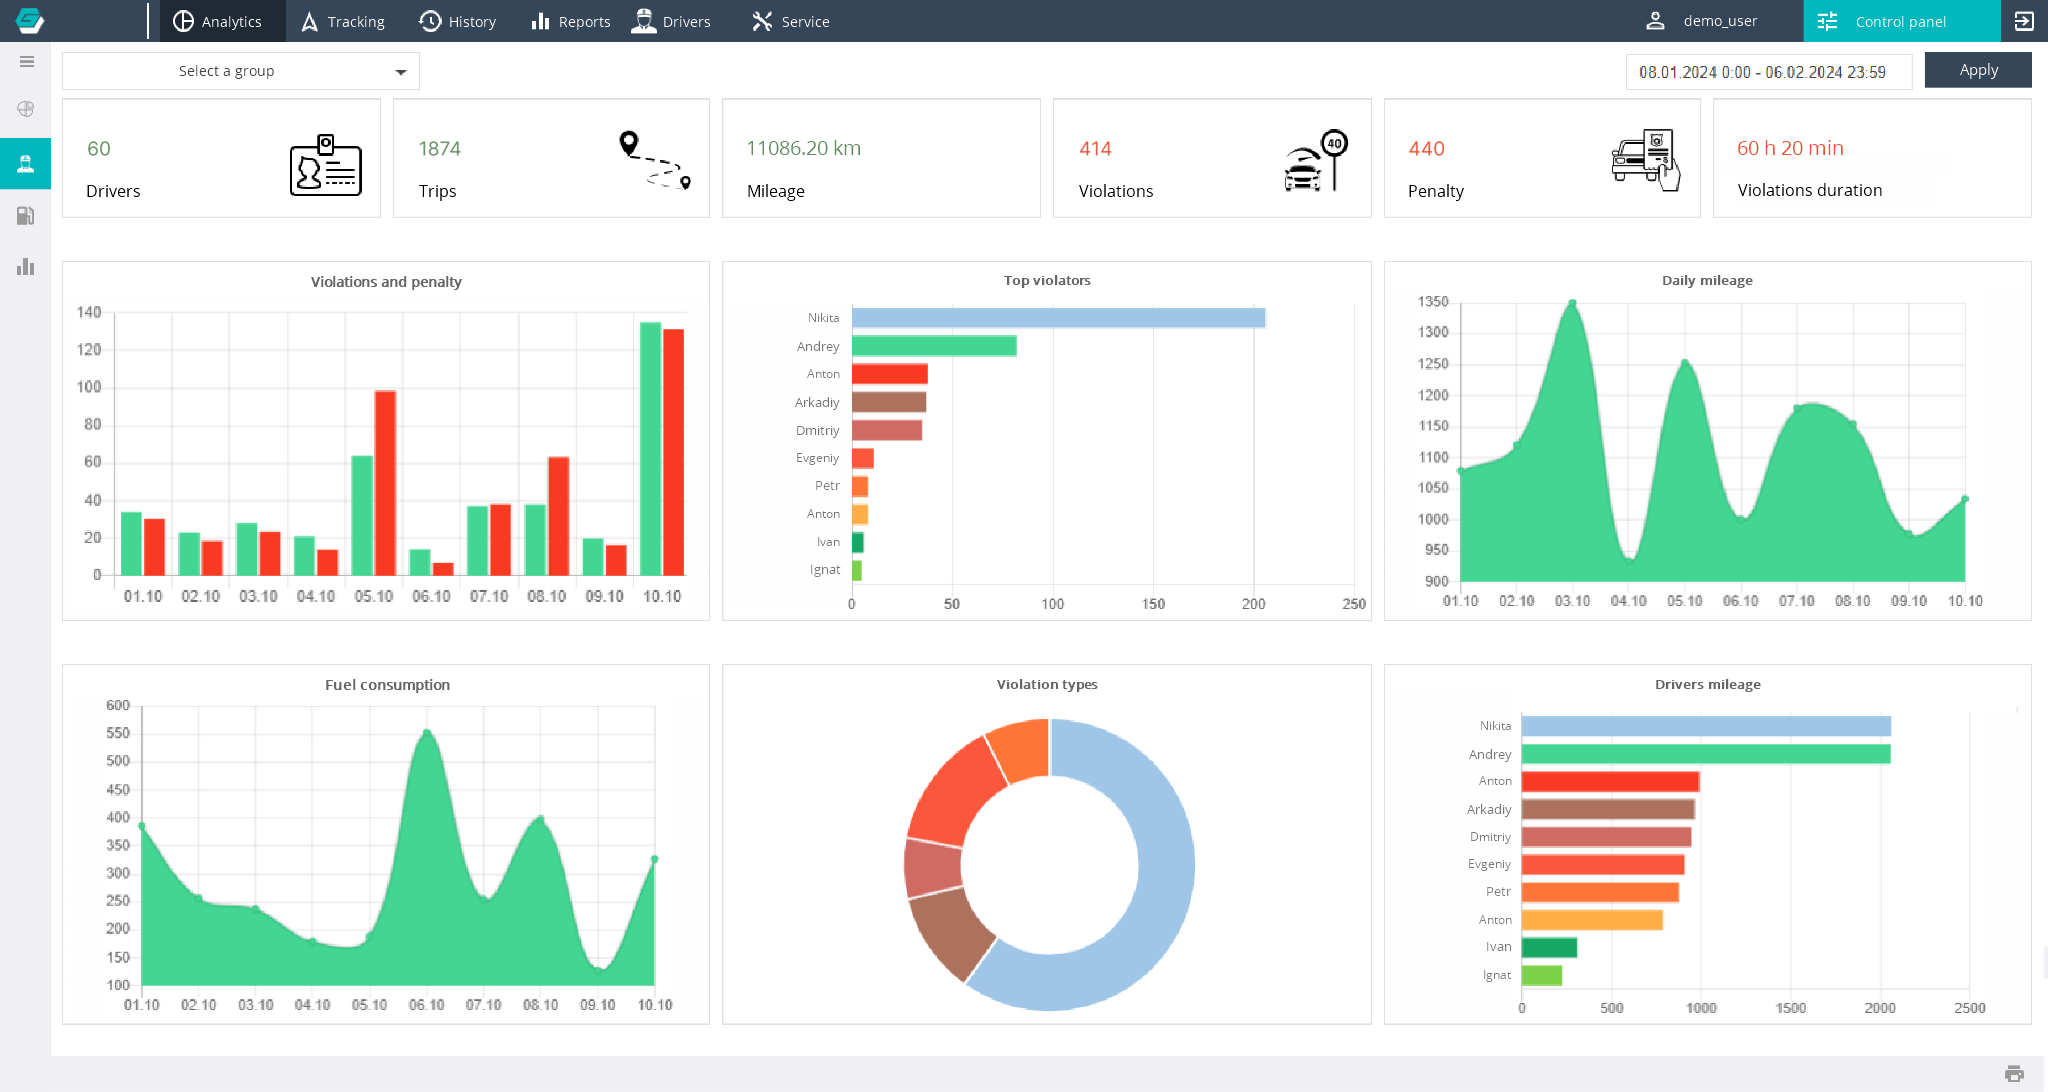
Choosing groups and period
At the top of the screen:
- Select a group — a drop-down list of driver groups with a search by name. Tick one or more groups — the figures are calculated for all drivers of the ticked groups, and their names appear in the field separated by commas. The All item clears the other groups and shows data for all of the User's drivers. The selection is remembered;
- date range — the period the figures are calculated for (the last 30 days by default);
- Apply — recalculate the figures and charts for the selected period.
Key figures
Totals for the drivers of the selected groups are shown above the charts:
- Drivers — the number of drivers in the selected groups;
- Trips — the number of trips over the period;
- Mileage — total mileage in trips;
- Violations — the number of violations;
- Penalty — the total penalty points for violations;
- Violations duration — the total duration of violations.
All figures except Drivers are calculated only from trips in which the driver was identified on the object. Trips without an identified driver are not included in the statistics.
Charts
- Violations and penalty — the number of violations and the total penalty points by day of the period;
- Top violators — up to 10 drivers with the highest total penalty points, values in points;
- Daily mileage — total mileage of the drivers by day of the period;
- Fuel consumption — total fuel consumption in trips by day of the period;
- Violation types — a pie chart: how many violations of each type were committed over the period;
- Drivers mileage — up to 10 drivers with the highest mileage over the period.
Bottom panel
In the lower right corner of the page:
| Icon | Action |
|---|---|
 | Print — open the browser's print dialog, where the page with the figures and charts can be printed or saved as PDF |