History
The History section allows you to view and analyze the movement history of selected objects (object track), statistics, and events over a selected time interval. The interval is set using the calendar and can have a duration of up to three months.
The section interface is identical to the Tracking section interface; the main differences concern the data displayed on the map and in the Information panel, which is present only in the "History" section.
The map has the capabilities described in the Map section. The working panel to the left of the map contains the "Objects", "Geozones", and "Drivers" tabs with the same functions as in the "Tracking" section.
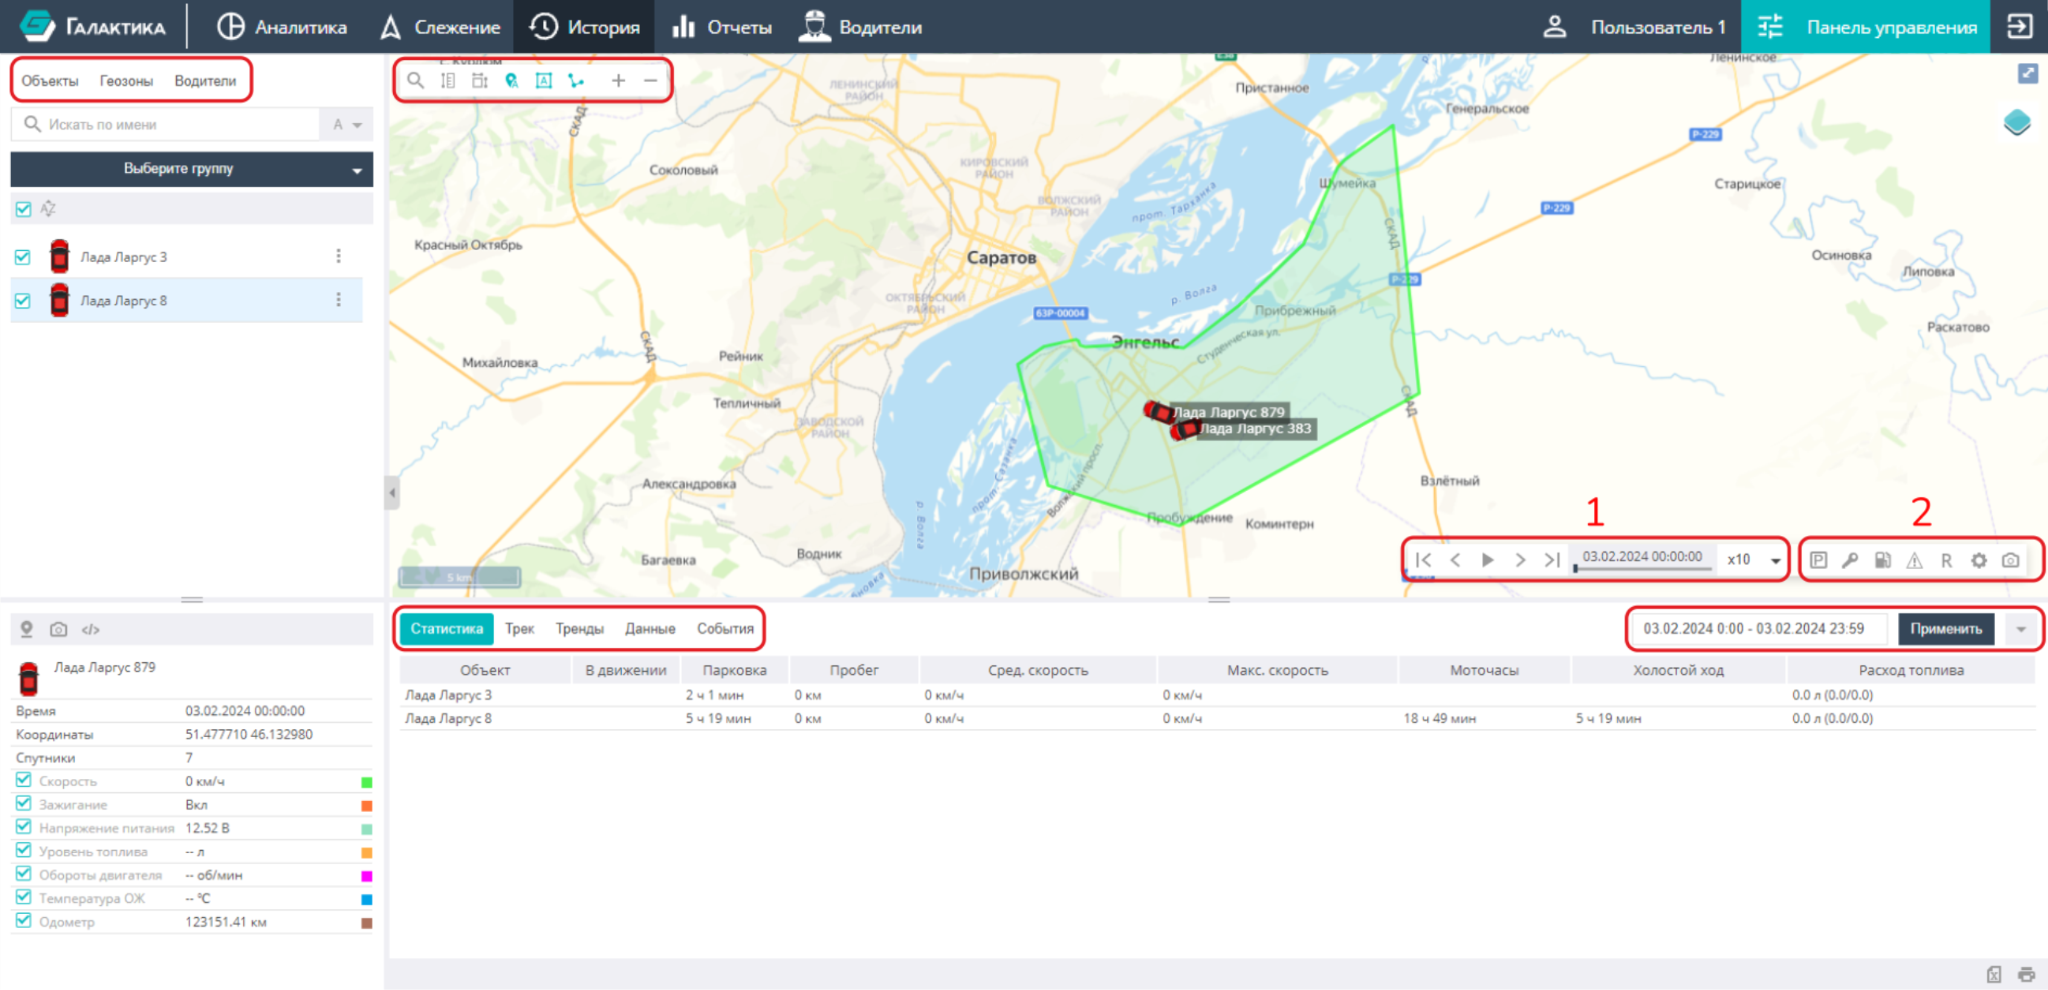
Unique to the "History" section are the functions on the playback and track settings panel in the lower right part of the map:
- Track playback — jumping to the start/end of the track, to the previous/next point, playback in accelerated mode over a given time interval, as well as pause.
- Controlling the display of information for the selected objects on the map:
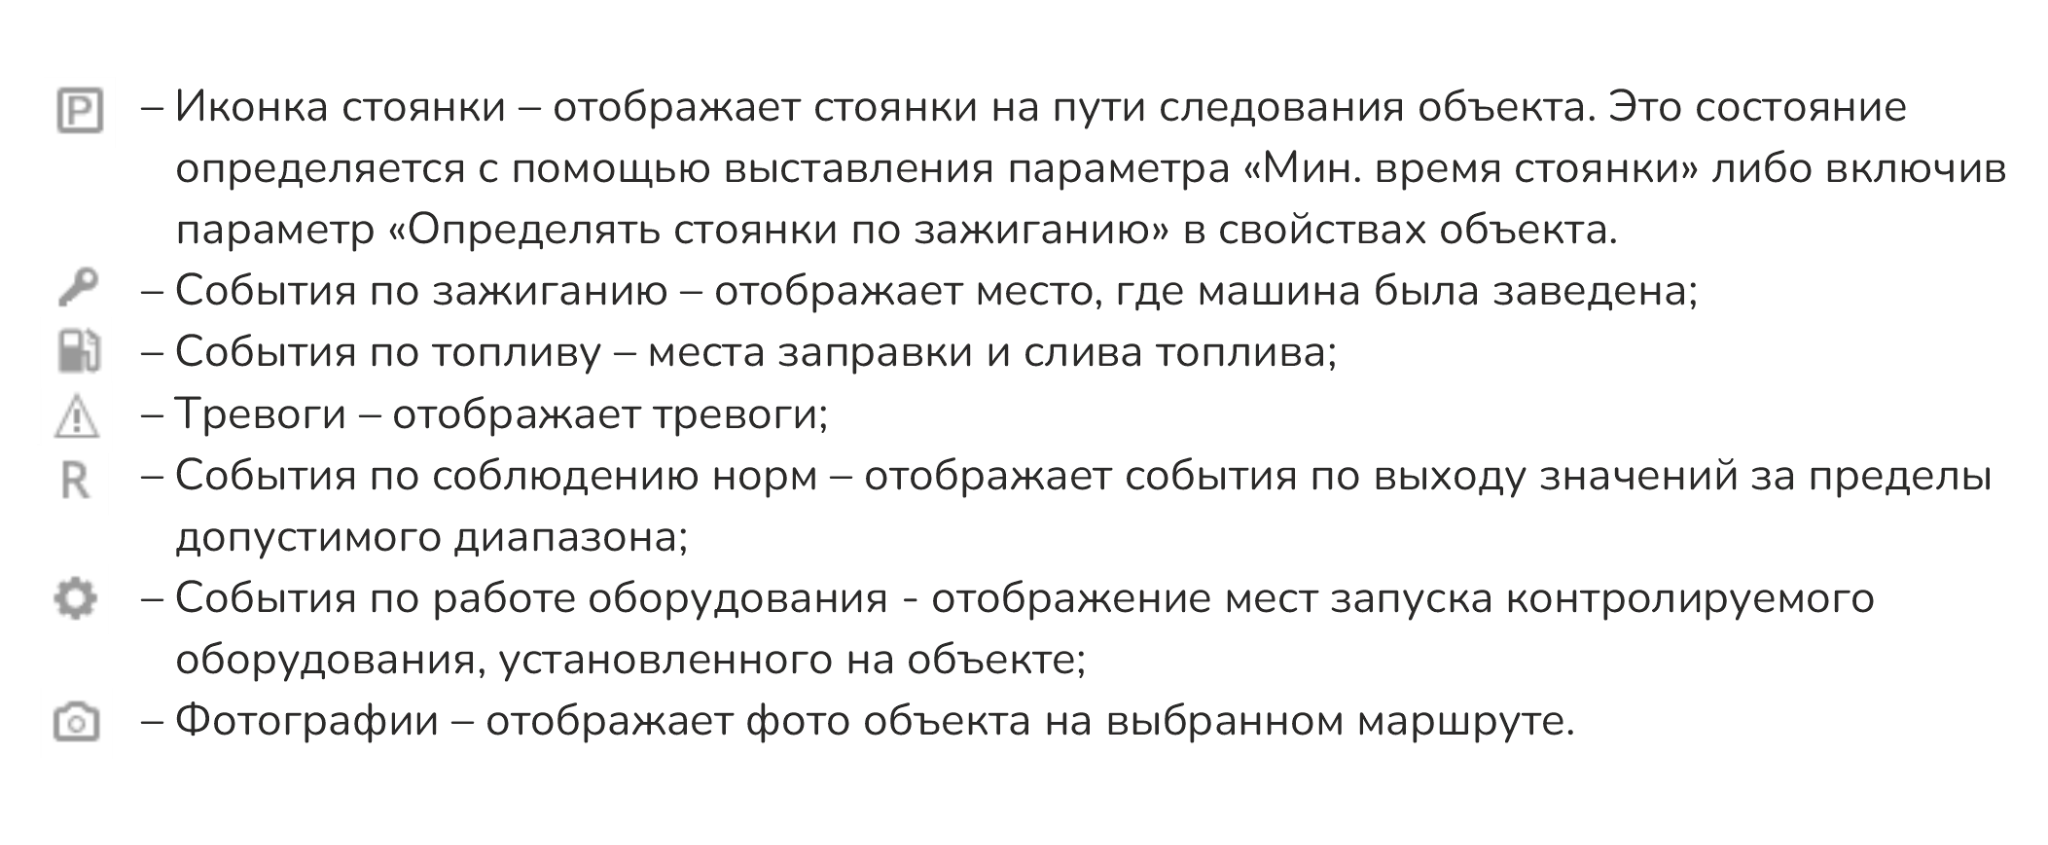
When switching to track viewing, all event markers on the map are enabled by default.
The Information panel below the map contains the following subsections:
- Statistics — a quick overview of summary information about objects;
- Track — data on movements and stops;
- Charts — object sensor charts together with the track;
- Data — sensor data of the highlighted object;
- Events — triggered events and alarms configured for the objects.
To display information about objects, you need to set a time period or work with the current day (by default). The information from these subsections, except for "Charts", can be exported to MS Excel, printed, or saved to PDF using the printer icon in the lower right corner of the page.