Interface layout
The system interface consists of the following structural elements:
-
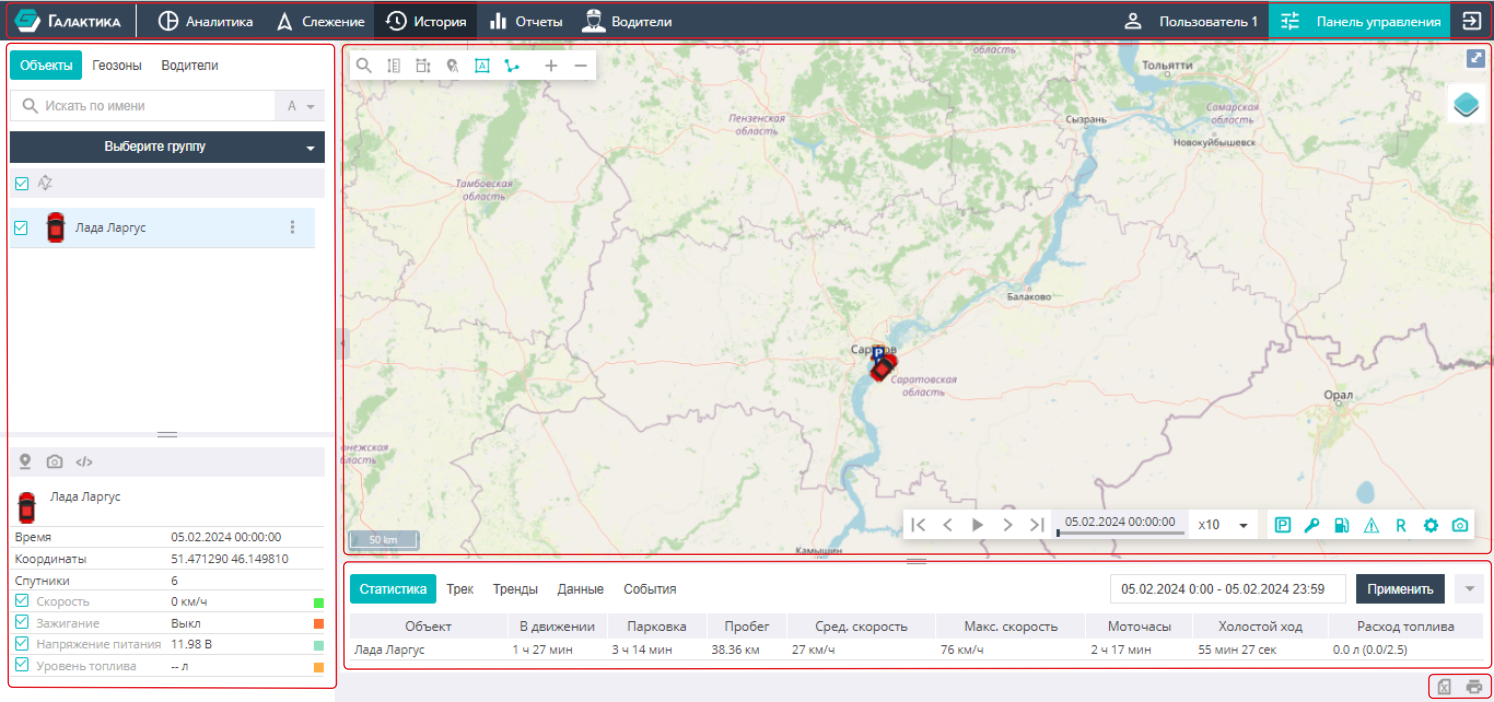
Top bar. Contains the monitoring provider's logo, the list of main-menu sections available to the current user, the signed-in user's name (a parent user may be shown in parentheses), and the current language indicator. Clicking the language indicator changes the interface language. On the right are the button to open the Control Panel (for users with system-management rights) and the sign-out button.
-
Map area. Available in the "Tracking" and "History" sections. It shows monitored objects, their movements, geozones, etc. The basemap selector is in the top-right corner. Map tools are at the top: search, route planning, a ruler for measuring distance, toggles for displaying geozone and object names, following a selected object, and drawing the object's trail (in the "Tracking" tab).
-
Work area. Located on the left side of the screen. It contains the main tools:
- display of the objects, geozones and drivers available to the user — by groups or as a single list;
- a quick object-state filter (online, with active alarms, parked, moving; unselected objects can be hidden). Several filters can be active at once;
- the object-actions interface (three vertical dots): center the map on the object, send a command, view photos, edit settings;
- a panel with detailed object status: last connection time, last address, coordinates, current speed and configured sensors.
-
Information panel. Shown only in the "History" section. It is used to assess object state and view data, statistics or charts together with the object track. It contains the subsections: Statistics, Track, Charts, Data, Events.
-
Additional tools panel. Its toolset depends on the active tab. The main tools are: toggling display of empty records, exporting data to an Excel spreadsheet, and printing data.