Charts
The charts display the values of the sensors installed on the selected object (engine temperature sensor, fuel level sensor, etc.) over the specified time interval. You can zoom in or out along the time axis using the "+" and "-" icons in the right part of the charts area or with the mouse wheel. You can also move the slider that controls the size of the information panel and set chart area dimensions convenient for work and analysis.
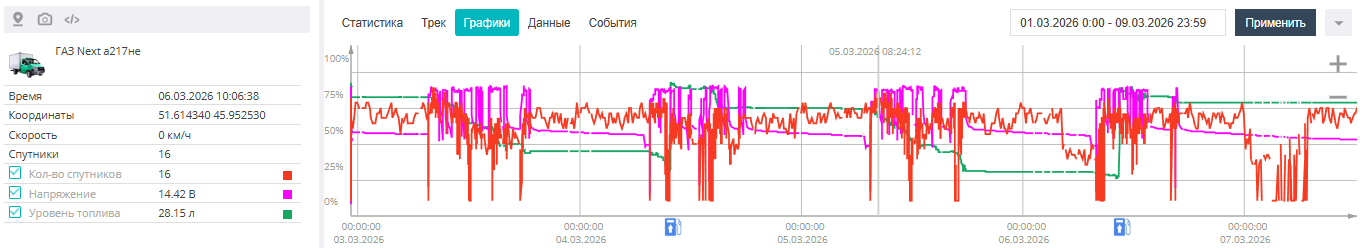
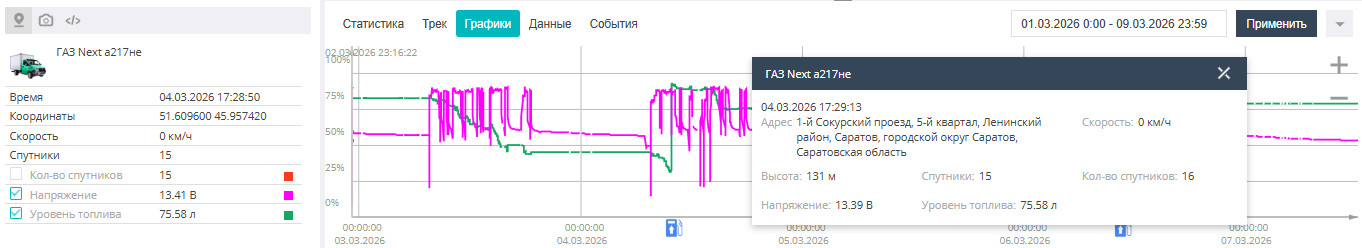
In the panel on the left, you can use the checkboxes to enable/disable the display of the object's configured sensors: fuel, ignition, speed data, etc. The color next to a particular sensor parameter corresponds to the color of the curve on the chart.
When you click on the chart at the required point along the time axis, a popup window appears with the values of the basic and configured sensors. The window will also present information about the date and time and the object's address at the specified moment in time.