Reports
The Reports subsection of the Analytics section lets you view information about objects in several report variants. The subsection interface is similar to the "Reports" section. All reports can be saved in Excel format, printed on a printer, or saved to a PDF file. A description of the available reports is provided below.
Summary report
This is a report that shows the total readings for the main parameters of the objects belonging to the User, namely: mileage, fuel consumption, time the object spent moving and idling, engine hours, parking time, and data on refuelings and drains. The time interval is selected at the top right of the page.
Daily report
This is a report for each day of the selected period, which presents the information of the Summary report and, additionally, specifies the object's final location. Grouping in this report is done by objects. The time interval is selected at the top right of the page.
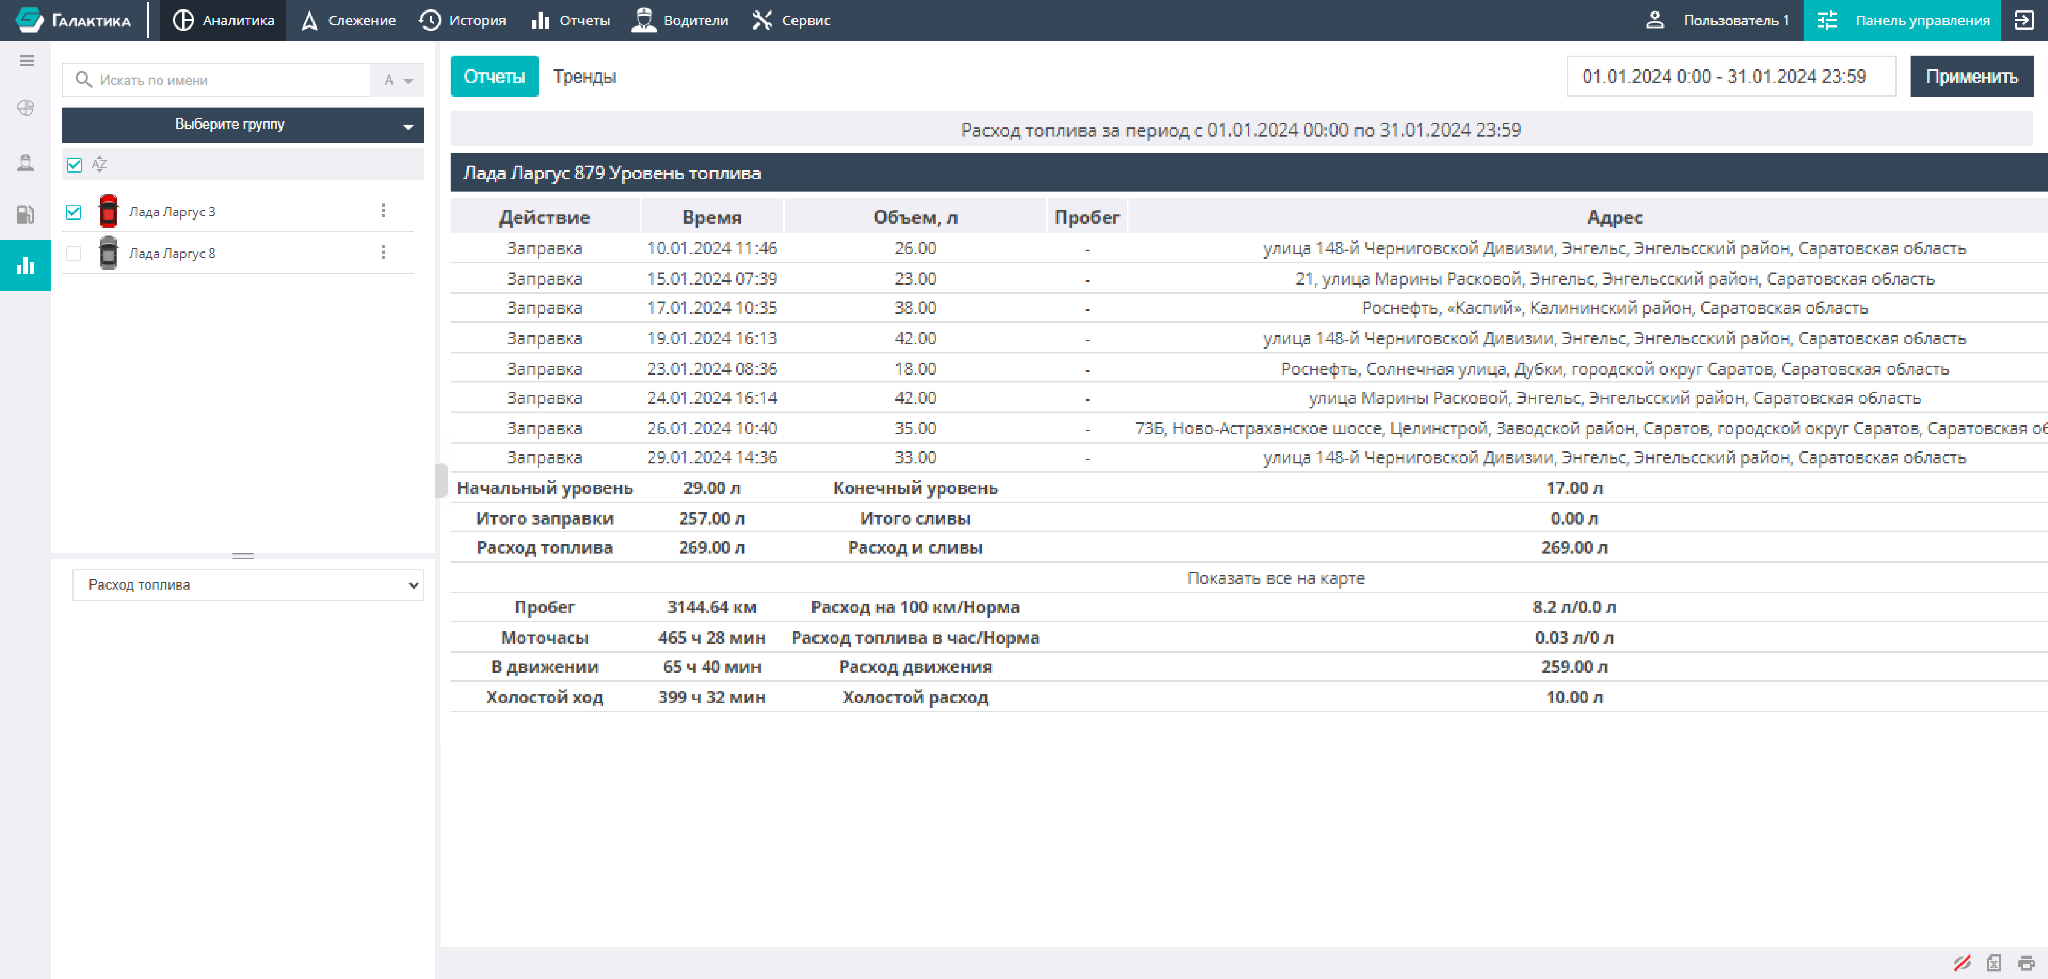
Fuel consumption
This report type lets you obtain information about an object's fuel movement: initial and final fuel levels, fuel consumption, drains and refuelings that occurred, mileage values, idling duration, and engine hours worked. It also calculates fuel consumption per 1 hour and fuel consumption per 100 km of mileage.
Monthly mileage report
This report is intended for comparing changes in mileage and fuel consumption by month. It lets you see the dynamics of changes in mileage and fuel consumption by object toward an increase in mileage/fuel consumption (positive dynamics) or a decrease in mileage/fuel consumption (negative dynamics). For clarity and ease of assessment, the change in dynamics is calculated as a percentage.
There is an option to filter the displayed values from the minimum mileage difference to the maximum. To obtain the calculations in the report and for correct calculation of the data, you need to select a time interval of two or more calendar months.