Objects
By default, the Analytics section opens on the Objects subsection. Here, summary information about the objects belonging to the User is presented clearly as diagrams and charts. The total number of objects, drivers, and geozones is shown separately, and information on the mileage, fuel consumption, and engine hours of the selected object group or all of the User's objects is clearly visible.
At the top of the screen you can select a specific object group and the desired time period.
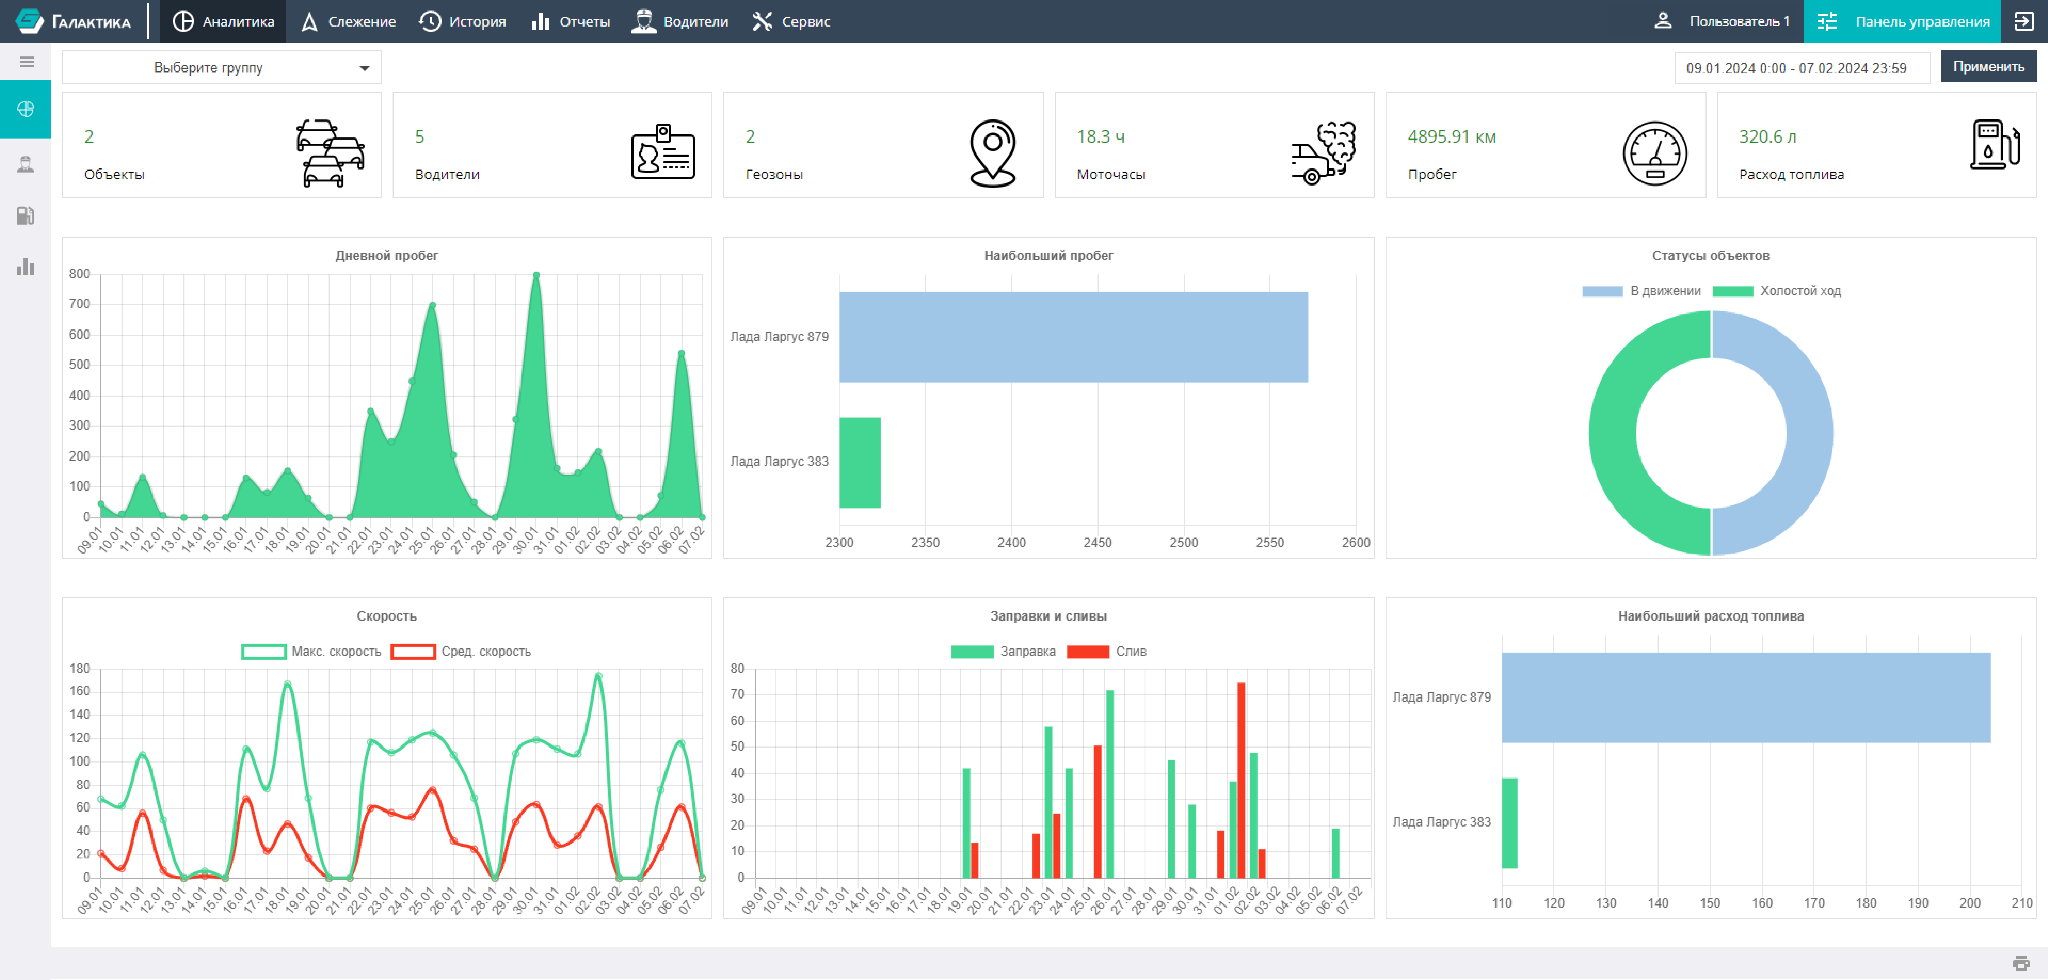
The analytical information about objects shown on the screen as diagrams and charts can be printed on a printer or saved as a PDF file by clicking the printer icon in the lower right corner of the page.