Analytics
This subsection enables you to view a driver's movement on the map, the geozones visited by the driver, track their route, and view related statistical data.
The interface of the Analytics subsection is largely similar to the History section.
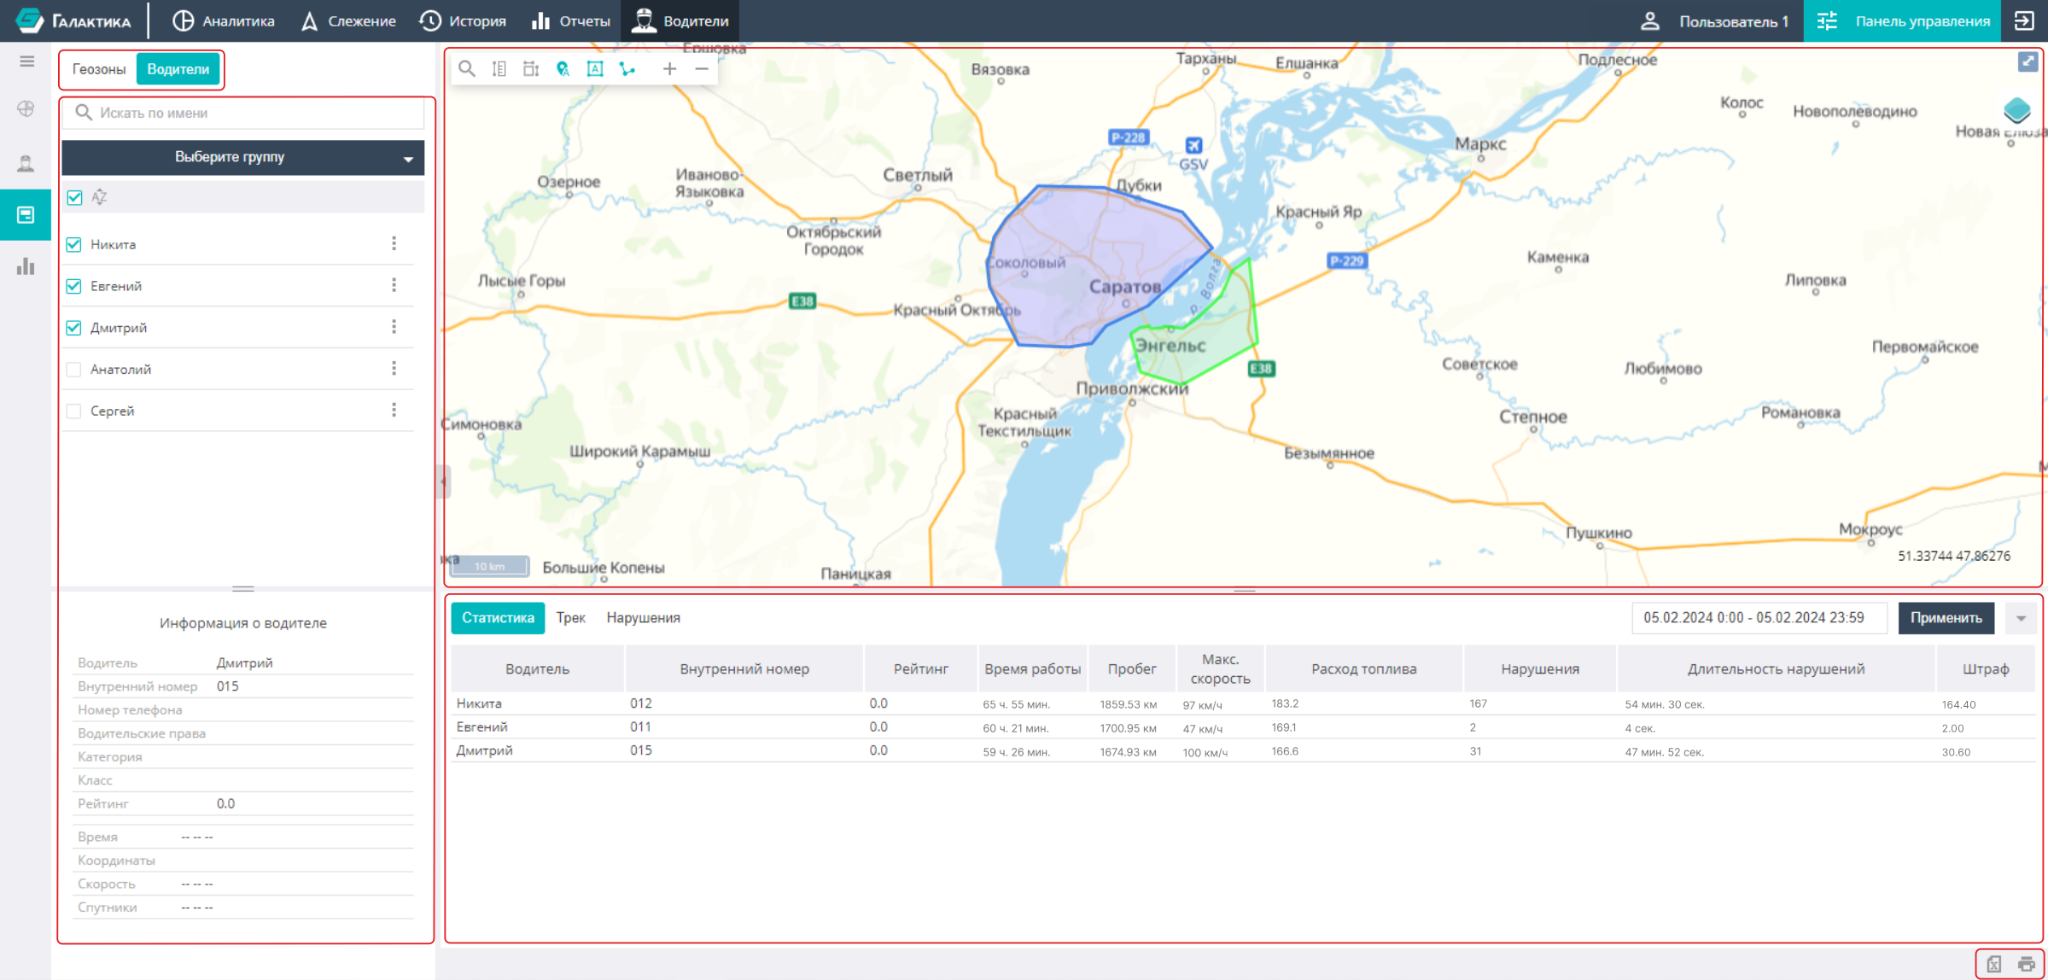
The work area contains several elements:
- Geozones;
- Drivers;
- Map;
- Bottom panel.
The Geozones and Drivers tabs contain a list of geozones and drivers entered into the system by the User. These tabs have an interface and functionality similar to the corresponding tabs of the Tracking section.
The map area contains a number of tools, working with which is described in detail in the Tracking and History sections.
In the bottom panel below the map, the following tabs are presented, displaying information about drivers and sensor readings:
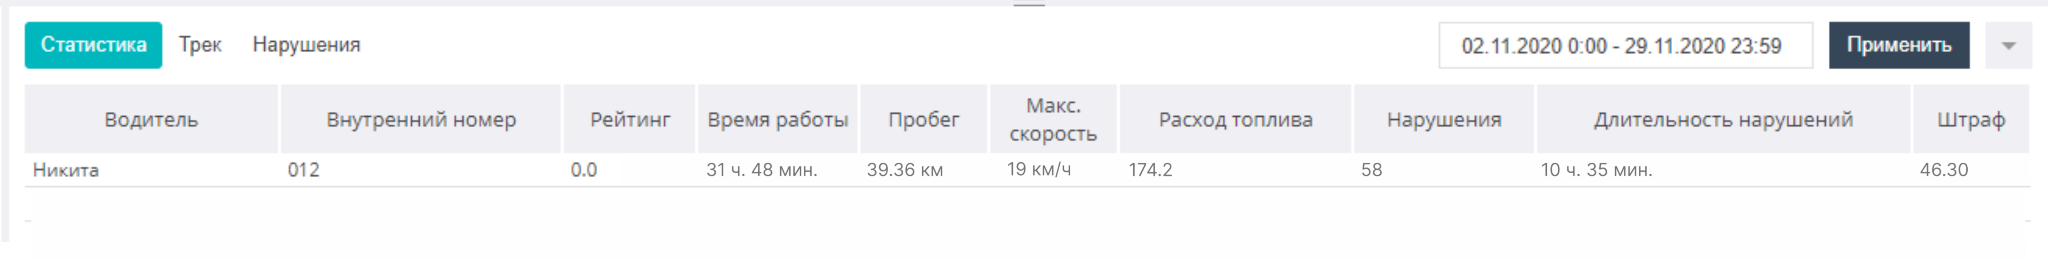
Statistics
The tab displays a report on each driver for the selected time interval. The report includes data on working time, mileage, fuel consumption, violations, etc.
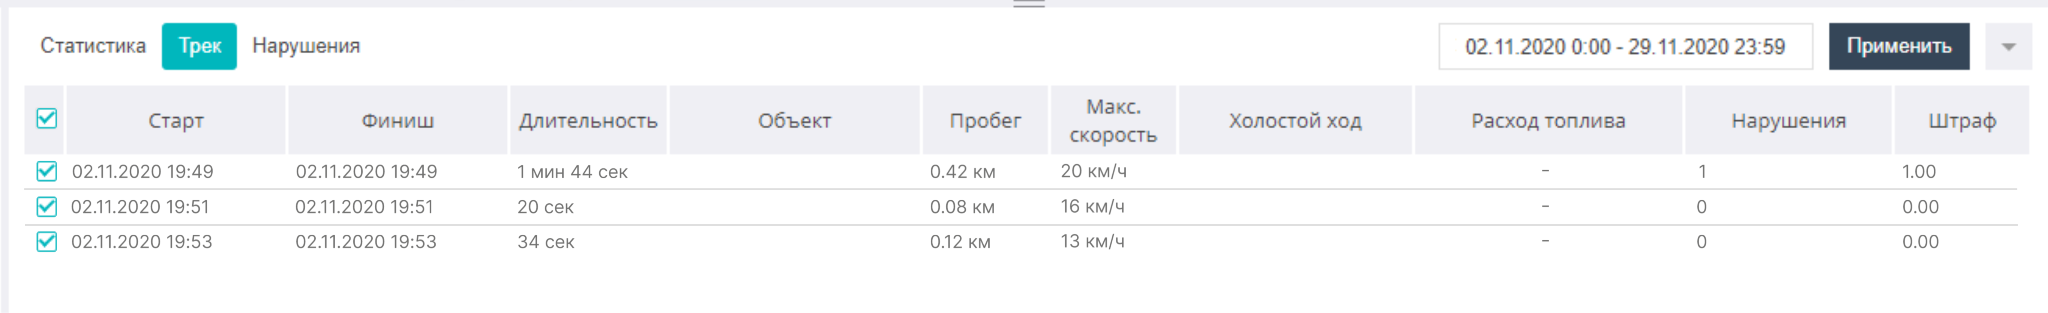
Track
The tab displays data on the movements of the selected driver. Each driver trip is accompanied by data on the vehicle, mileage, fuel consumption, violations, etc.
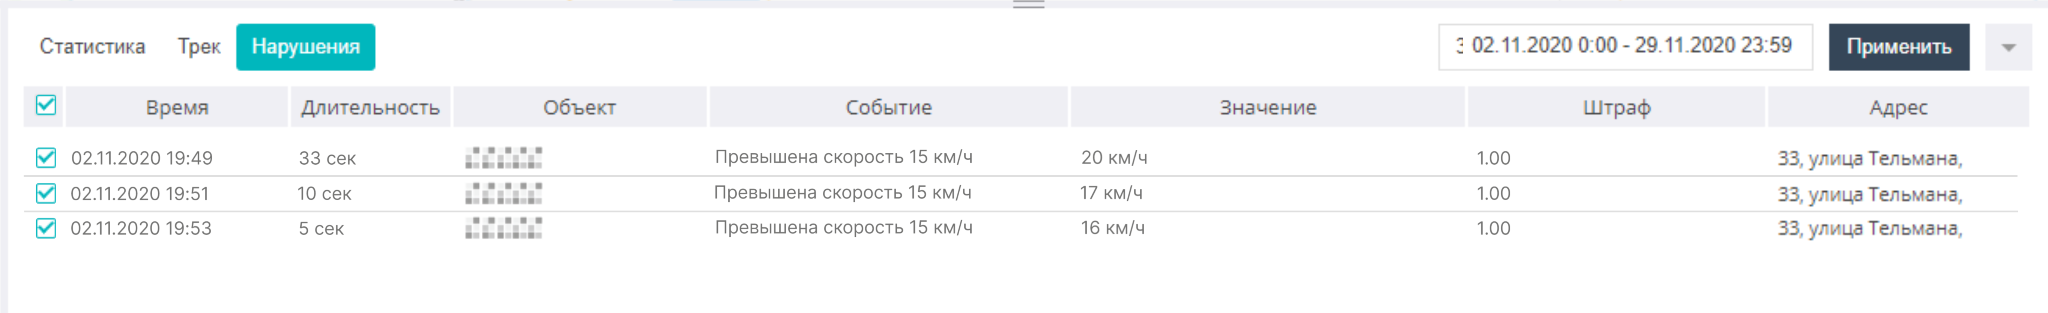
Violations
The tab contains a list of violations by the selected driver. Each violation description is accompanied by the time, vehicle data, penalty points, and address.